The Annual Clinical Trials Roundup
Our latest Clinical Trials Roundup focuses on Phase I–III clinical trials initiated in 2023 across all therapeutic areas covered by Trialtrove. This annual report includes in-depth analyses of key diseases, sponsoring companies, and geographies that impact the pharma industry, as well as a look at what’s ahead so you can elevate your clinical trials strategy.
Source: Trialtrove, June 2024
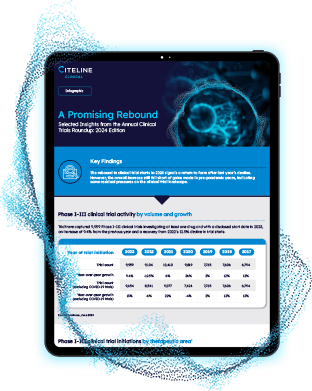
This infographic gives you a sampling of top-line findings from the annual Clinical Trials Roundup 2024 Edition, as well as a snapshot of the trends that drove 2023’s rebound in trial starts.
Rankings of top 10 industry trial sponsors for 2023
Source: Trialtrove, June 2024
The Annual Clinical Trials Roundup 2024 Edition, powered by Trialtrove, offers multilayered insights into 2023’s recovery in trial starts and how trial initiations break down among companies, therapeutic, and geographic areas.

Exploring the Asia-Pacific Clinical Trials Landscape: Asking the Five W’s
The Asia-Pacific (APAC) region has emerged as a hub for global clinical trials in recent years. Since 2021, APAC has outpaced the rest of the world (RoW) in terms of clinical trial starts, making this a key region of focus for clinical planning.
Number of Phase I–IV trials starts in APAC by trial locations, percentage of APAC trials, and CAGR, 2019–23
Source: Trialtrove, August 2024
This infographic gives highlights from the white paper, “Exploring the Asia-Pacific Clinical Trials Landscape: Asking the Five W’s,” which presents Trialtrove-curated information on trial starts in the APAC region.
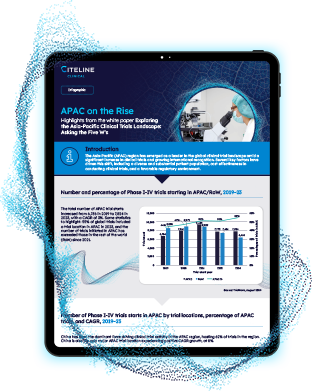
Number and percentage of Phase I–IV trials starting in APAC/RoW, 2019–23
Source: Trialtrove, August 2024
Our white paper, “Exploring the Asia-Pacific Clinical Trials Landscape: Asking the Five W’s,” takes a detailed look at clinical trial initiations in the APAC region, as well as the top countries and therapeutic areas within its borders.

Trialtrove: the tool behind the data
Meet Trialtrove, the engine driving these reports. This powerful solution delivers world-class data to help you design and run more cost-effective clinical trials with better outcomes and less risk. With Trialtrove, you can optimize your protocol design, anticipate competitive threats to your programs, and use feasibility and trial timing analysis to inform your country selection.

Book a demo
Book a meeting today to explore how Trialtrove can help.